Gold-Tech: Designing an IoT factory monitoring OS
Gold-Tech: Designing an IoT factory monitoring OS
Gold-Tech: Designing an IoT factory monitoring OS
Designed a factory IoT monitoring dashboard to simplify complex machine data, enabling faster decision-making, reducing monitoring time by 40%, and improving overall operational efficiency.
I designed an IoT-powered ecosystem that
gives factory owners real-time visibility,
reduces downtime, and improves overall operational health.
Platform
Web (Factory OS) & Desktop App
Web (Factory OS) & Desktop App
Client
Gold Tech
Gold Tech
Industry
Industrial IoT / Manufacturing SaaS
Industrial IoT / Manufacturing SaaS
Product Design
IOT Design
Figma AI
Factory App
Sass Platform
Product Design
IOT Design
Figma AI
Factory App
Sass Platform
About this project
About this project
About this project
Modern factories generate massive real-time data through IoT sensors, but most platforms fail to present this data usably — leading to confusion and delayed decisions. This project focused on designing a scalable, intuitive dashboard system that transforms raw machine data into meaningful insights and improves operational efficiency.
Modern factories generate massive real-time data through IoT sensors, but most platforms fail to present this data usably — leading to confusion and delayed decisions. This project focused on designing a scalable, intuitive dashboard system that transforms raw machine data into meaningful insights and improves operational efficiency.
Problem
Factories generate a huge amount of data from IoT sensors, but teams were still relying on WhatsApp messages, spreadsheets, and manual checks to monitor machines.
This made it difficult to quickly understand what was happening on the factory floor and spot potential issues before they caused downtime.
Factories generate a huge amount of data from IoT sensors, but teams were still relying on WhatsApp messages, spreadsheets, and manual checks to monitor machines.
This made it difficult to quickly understand what was happening on the factory floor and spot potential issues before they caused downtime.
Solution
Created one connected monitoring system with two experiences built for different users. Factory managers get a web dashboard for overall performance, alerts, and reporting, while technicians get a desktop app focused on machine details, tasks, and maintenance.Both products use the same design system to keep the experience consistent.
Created one connected monitoring system with two experiences built for different users. Factory managers get a web dashboard for overall performance, alerts, and reporting, while technicians get a desktop app focused on machine details, tasks, and maintenance.Both products use the same design system to keep the experience consistent.
Team
Client
Me (Product Designer)
Product Manager, Engineers
My role
Senior UX/UI Product Designer
Tools
Figma, Notion, FigJam, AI Tools
Timeline
4 week
Key Design Decisions
Key Design Decisions
Key Design Decisions
One dashboard for everyone → Separate experiences for each role
One dashboard for everyone → Separate experiences for each role
One dashboard for everyone → Separate experiences for each role
Problem
Problem
Managers needed a quick overview of the entire factory, while technicians needed detailed information about individual machines. One dashboard couldn't serve both needs effectively.
Managers needed a quick overview of the entire factory, while technicians needed detailed information about individual machines. One dashboard couldn't serve both needs effectively.
Design Decision
Design Decision
Created two connected products: a web dashboard for managers and a desktop app for technicians, using the same design system.
Created two connected products: a web dashboard for managers and a desktop app for technicians, using the same design system.
Result
Result
Each team gets the information and tools they need without unnecessary complexity.
Each team gets the information and tools they need without unnecessary complexity.
All alerts looked the same → Prioritized alerts
All alerts looked the same → Prioritized alerts
All alerts looked the same → Prioritized alerts
Problem
Problem
Teams couldn't easily tell which issues needed immediate attention and which were routine updates.
Teams couldn't easily tell which issues needed immediate attention and which were routine updates.
Design Decision
Design Decision
Added clear alert priorities across the dashboard and Device & Sensor Management screens.
Added clear alert priorities across the dashboard and Device & Sensor Management screens.
Result
Result
Teams can quickly identify which issues need attention first.
Complex sensor data → Easy-to-scan information
Complex sensor data → Easy-to-scan information
Complex sensor data → Easy-to-scan information
Problem
Problem
There was a lot of sensor data to understand, often in situations where teams needed to make decisions quickly.
There was a lot of sensor data to understand, often in situations where teams needed to make decisions quickly.
Design Decision
Design Decision
Organized the data into clear KPI cards, trend charts, and status indicators.
Organized the data into clear KPI cards, trend charts, and status indicators.
Result
Result
Important information is easier to understand at a glance.
Important information is easier to understand at a glance.
Planning outside the system → Planning in one place
Planning outside the system → Planning in one place
Planning outside the system → Planning in one place
Problem
Problem
Manufacturing planning was handled separately from machine and workforce information, making it harder to plan around current operations.
Manufacturing planning was handled separately from machine and workforce information, making it harder to plan around current operations.
Design Decision
Design Decision
Added Manufacturing Planning & Scheduling directly into the platform.
Added Manufacturing Planning & Scheduling directly into the platform.
Result
Result
Teams can plan work using the same information they use to monitor daily operations.
Teams can plan work using the same information they use to monitor daily operations.
Final Product
Final Product
Final Product
The Factory Operations Dashboard brings real-time KPIs, quality information, and performance trends into one central view.
The Factory Operations Dashboard brings real-time KPIs, quality information, and performance trends into one central view.
The Factory Operations Dashboard brings real-time KPIs, quality information, and performance trends into one central view.
It gives managers a quick way to understand the current state of the factory and identify areas that need attention.
It gives managers a quick way to understand the current state of the factory and identify areas that need attention.
It gives managers a quick way to understand the current state of the factory and identify areas that need attention.
Factory Operations
Dashboard
Factory Operations
Dashboard
A centralized dashboard bringing production, machine performance, quality, workforce, and operational data into one view.
A centralized dashboard bringing production, machine performance, quality, workforce, and operational data into one view.
A centralized dashboard bringing production, machine performance, quality, workforce, and operational data into one view.
Real-time KPIs and visual analytics help teams quickly identify performance gaps and make informed decisions.
Real-time KPIs and visual analytics help teams quickly identify performance gaps and make informed decisions.
Real-time KPIs and visual analytics help teams quickly identify performance gaps and make informed decisions.

IoT Smart Factory
Monitoring Platform
IoT Smart Factory
Monitoring Platform
A centralized industrial platform designed to monitor machine performance, production, and real-time sensor data.
A centralized industrial platform designed to monitor machine performance, production, and real-time sensor data.
A centralized industrial platform designed to monitor machine performance, production, and real-time sensor data.
The interface transforms complex factory data into clear dashboards, machine insights, alerts, and performance metrics—helping teams identify issues and make faster operational decisions.
The interface transforms complex factory data into clear dashboards, machine insights, alerts, and performance metrics—helping teams identify issues and make faster operational decisions.
The interface transforms complex factory data into clear dashboards, machine insights, alerts, and performance metrics—helping teams identify issues and make faster operational decisions.

Operational
Performance Insights
Operational
Performance Insights
A data-rich operational view designed to track production efficiency, machine timelines, quality metrics, and workforce productivity.
A data-rich operational view designed to track production efficiency, machine timelines, quality metrics, and workforce productivity.
A data-rich operational view designed to track production efficiency, machine timelines, quality metrics, and workforce productivity.
Clear visualizations turn complex factory data into actionable insights for faster decision-making.
Clear visualizations turn complex factory data into actionable insights for faster decision-making.
Clear visualizations turn complex factory data into actionable insights for faster decision-making.


Manufacturing Planning
& Scheduling
Manufacturing Planning
& Scheduling
A visual production planning experience for scheduling machines, operators, and manufacturing activities.
A visual production planning experience for scheduling machines, operators, and manufacturing activities.
A visual production planning experience for scheduling machines, operators, and manufacturing activities.
Timeline-based views help teams understand workloads, machine availability, and production schedules at a glance.
Timeline-based views help teams understand workloads, machine availability, and production schedules at a glance.
Timeline-based views help teams understand workloads, machine availability, and production schedules at a glance.
Device & Sensor Management
Device & Sensor Management
A centralized view for monitoring connected devices and gateways across the factory. Users can quickly identify active, offline, and warning states, making device health easier to manage at scale.
A centralized view for monitoring connected devices and gateways across the factory. Users can quickly identify active, offline, and warning states, making device health easier to manage at scale.
A centralized view for monitoring connected devices and gateways across the factory. Users can quickly identify active, offline, and warning states, making device health easier to manage at scale.

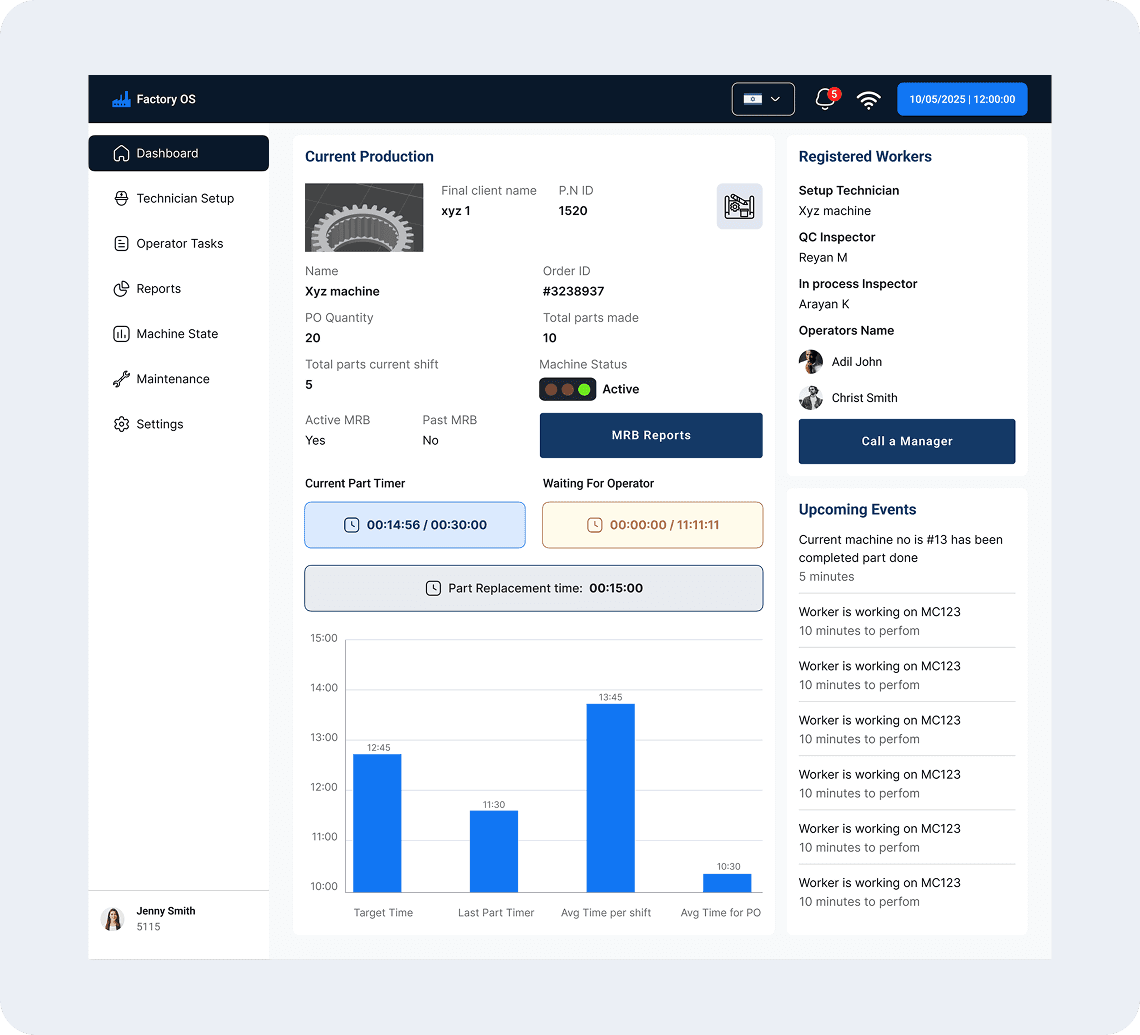
Factory OS Real-Time
Production Dashboard
Factory OS Real-Time
Production Dashboard
A centralized factory operations interface designed to give teams real-time visibility into production, machine status, worker activity, and upcoming events.
A centralized factory operations interface designed to give teams real-time visibility into production, machine status, worker activity, and upcoming events.
A centralized factory operations interface designed to give teams real-time visibility into production, machine status, worker activity, and upcoming events.
The dashboard brings critical operational data together, helping supervisors monitor performance, manage production tasks, and respond quickly to issues.
The dashboard brings critical operational data together, helping supervisors monitor performance, manage production tasks, and respond quickly to issues.
The dashboard brings critical operational data together, helping supervisors monitor performance, manage production tasks, and respond quickly to issues.
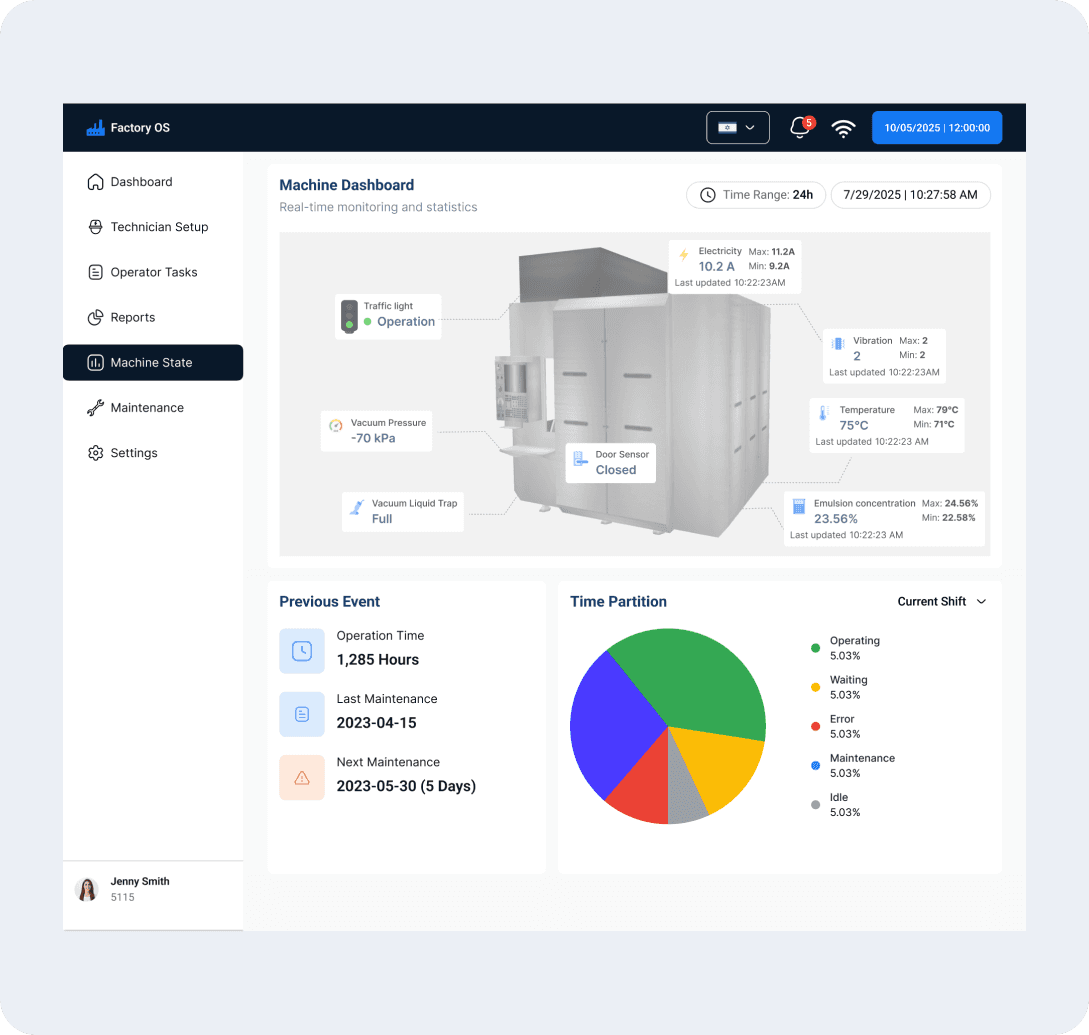
Machine Detail
Machine Detail
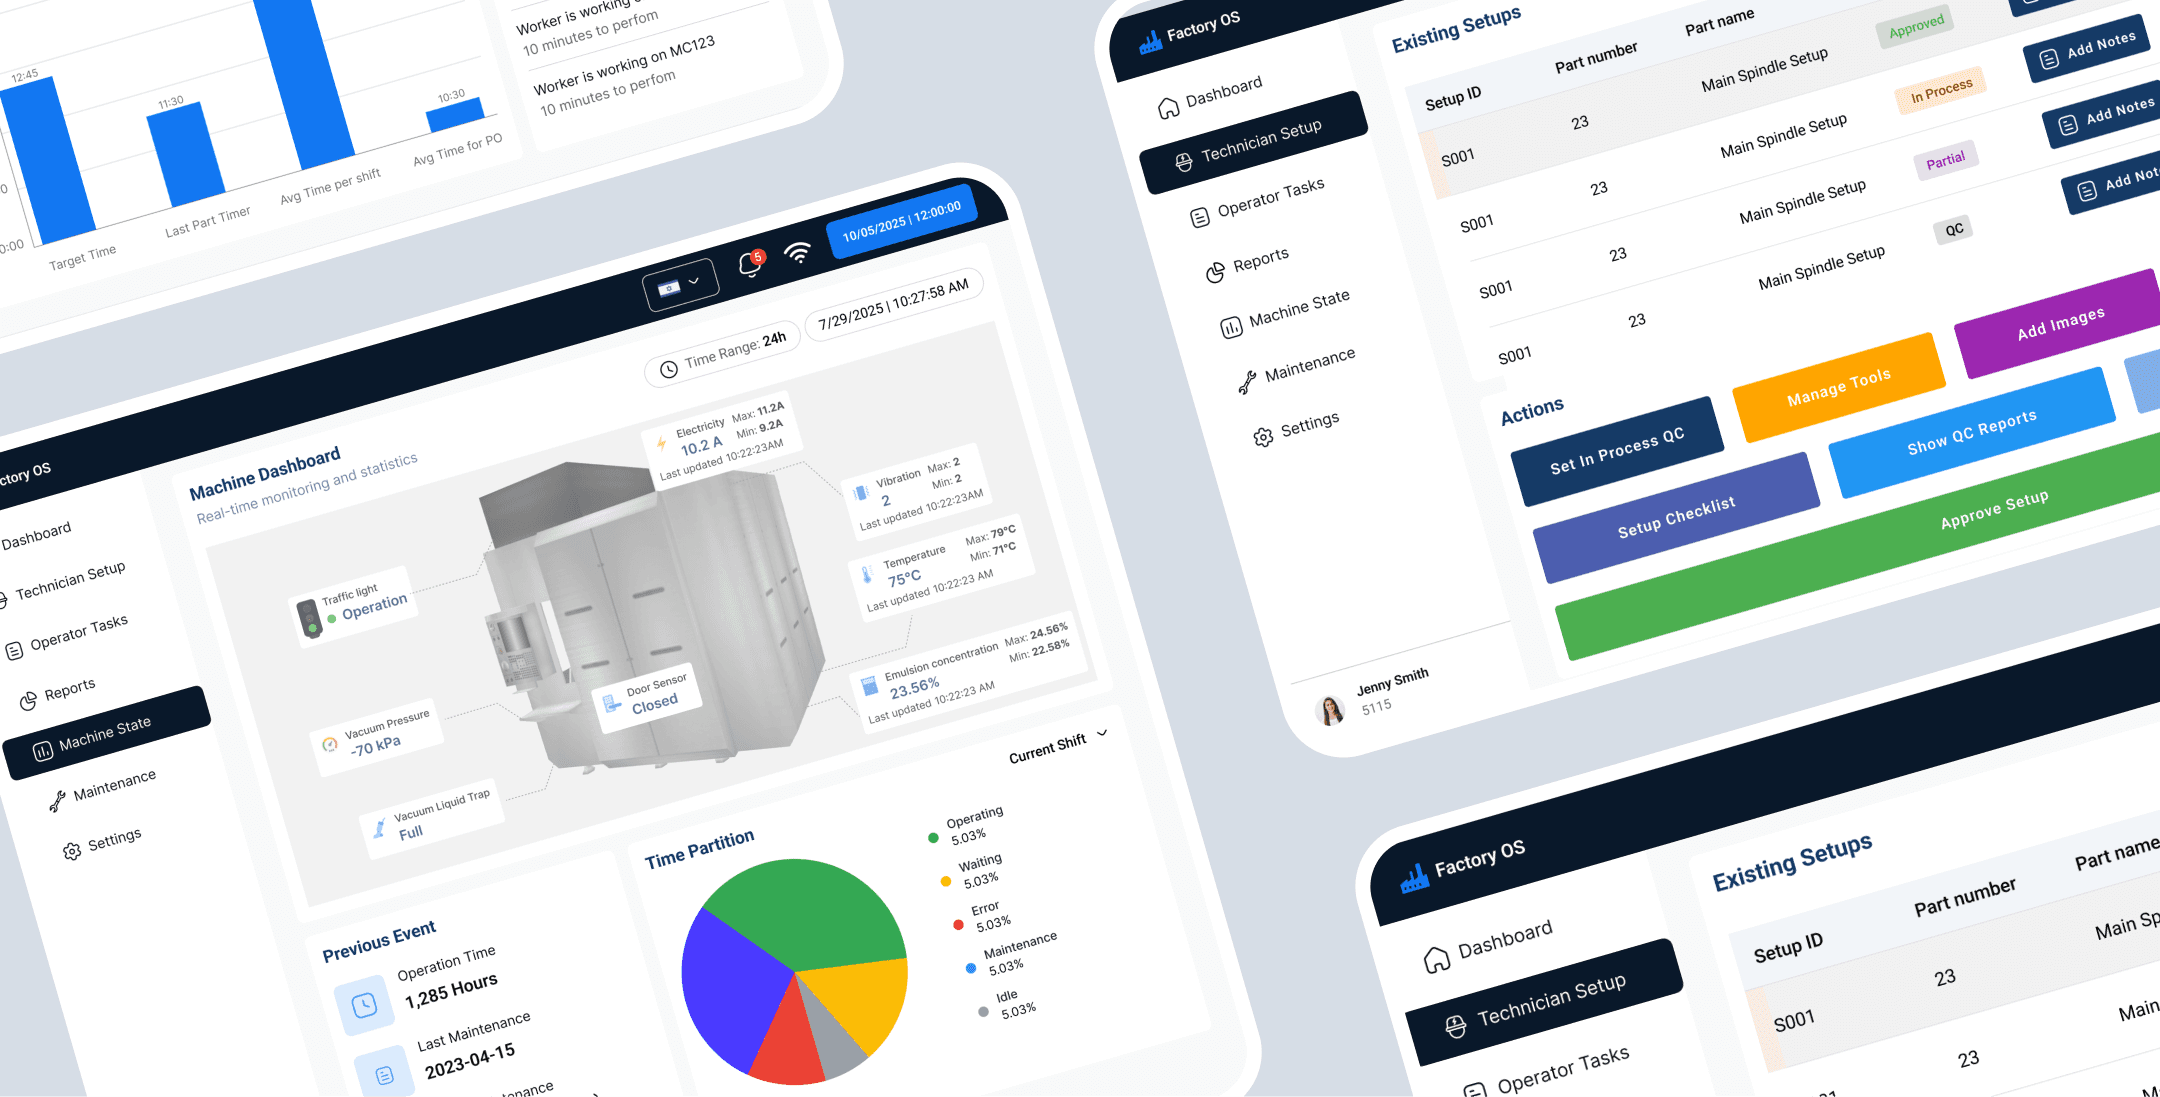
This screen shows real-time machine metrics, historical trends, and predictive behavior in one place. Users can view alerts, maintenance history, and data patterns to understand the root cause of issues.
This screen shows real-time machine metrics, historical trends, and predictive behavior in one place. Users can view alerts, maintenance history, and data patterns to understand the root cause of issues.
This screen shows real-time machine metrics, historical trends, and predictive behavior in one place. Users can view alerts, maintenance history, and data patterns to understand the root cause of issues.
With quick actions like assigning technicians or scheduling maintenance, teams can act immediately without switching screens.
With quick actions like assigning technicians or scheduling maintenance, teams can act immediately without switching screens.
With quick actions like assigning technicians or scheduling maintenance, teams can act immediately without switching screens.
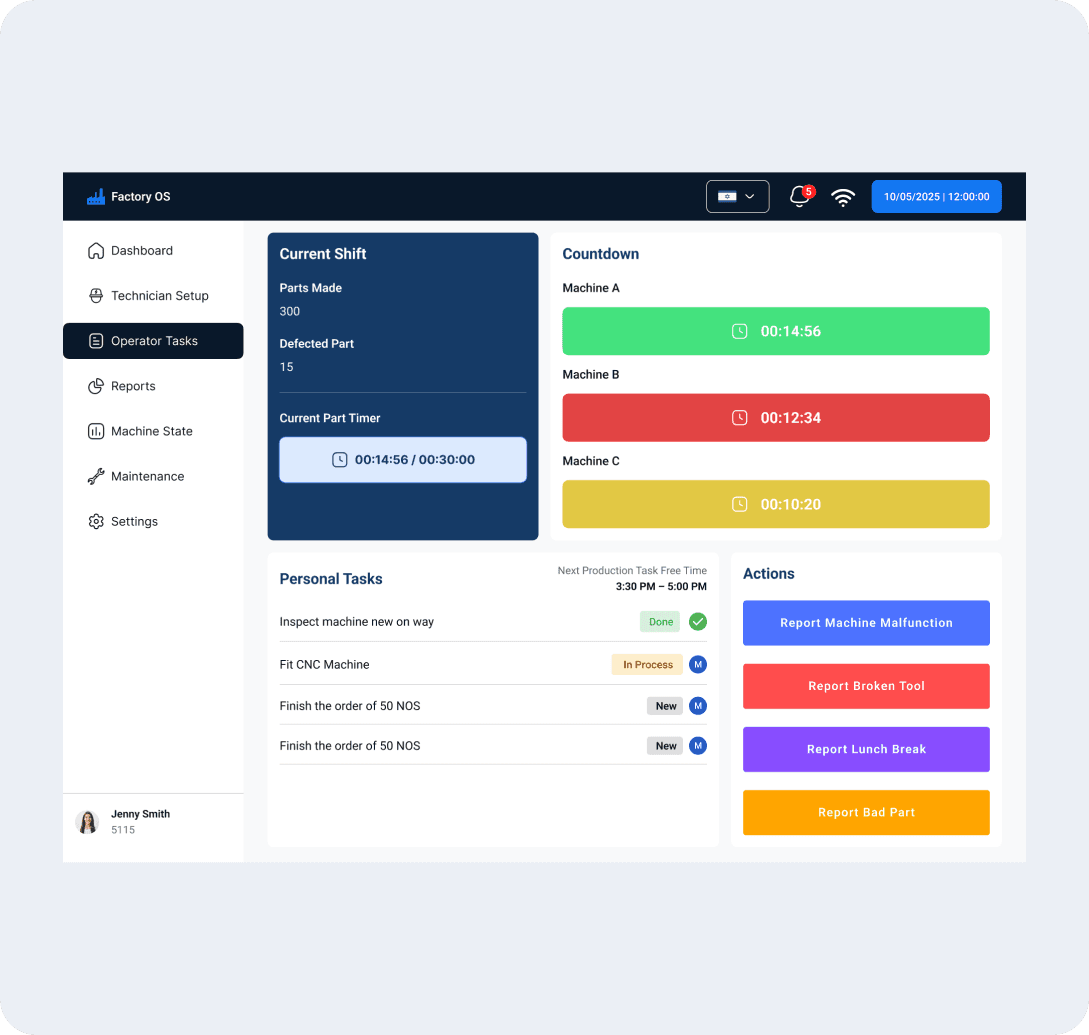
Operator Task
Operator Task
The operator task screen shows a clear list of assigned tasks such as inspections, machine checks, or routine maintenance steps. Each task includes priority, due time, and the machine it belongs to, helping operators stay organized. Simple actions like “Start,” “Mark Complete,” or “Add Notes” keep workflows smooth and trackable. This screen ensures operators always know what to do next and reduces delays on the factory floor.
The operator task screen shows a clear list of assigned tasks such as inspections, machine checks, or routine maintenance steps. Each task includes priority, due time, and the machine it belongs to, helping operators stay organized. Simple actions like “Start,” “Mark Complete,” or “Add Notes” keep workflows smooth and trackable. This screen ensures operators always know what to do next and reduces delays on the factory floor.
The operator task screen shows a clear list of assigned tasks such as inspections, machine checks, or routine maintenance steps. Each task includes priority, due time, and the machine it belongs to, helping operators stay organized. Simple actions like “Start,” “Mark Complete,” or “Add Notes” keep workflows smooth and trackable. This screen ensures operators always know what to do next and reduces delays on the factory floor.
Reports / Analytics
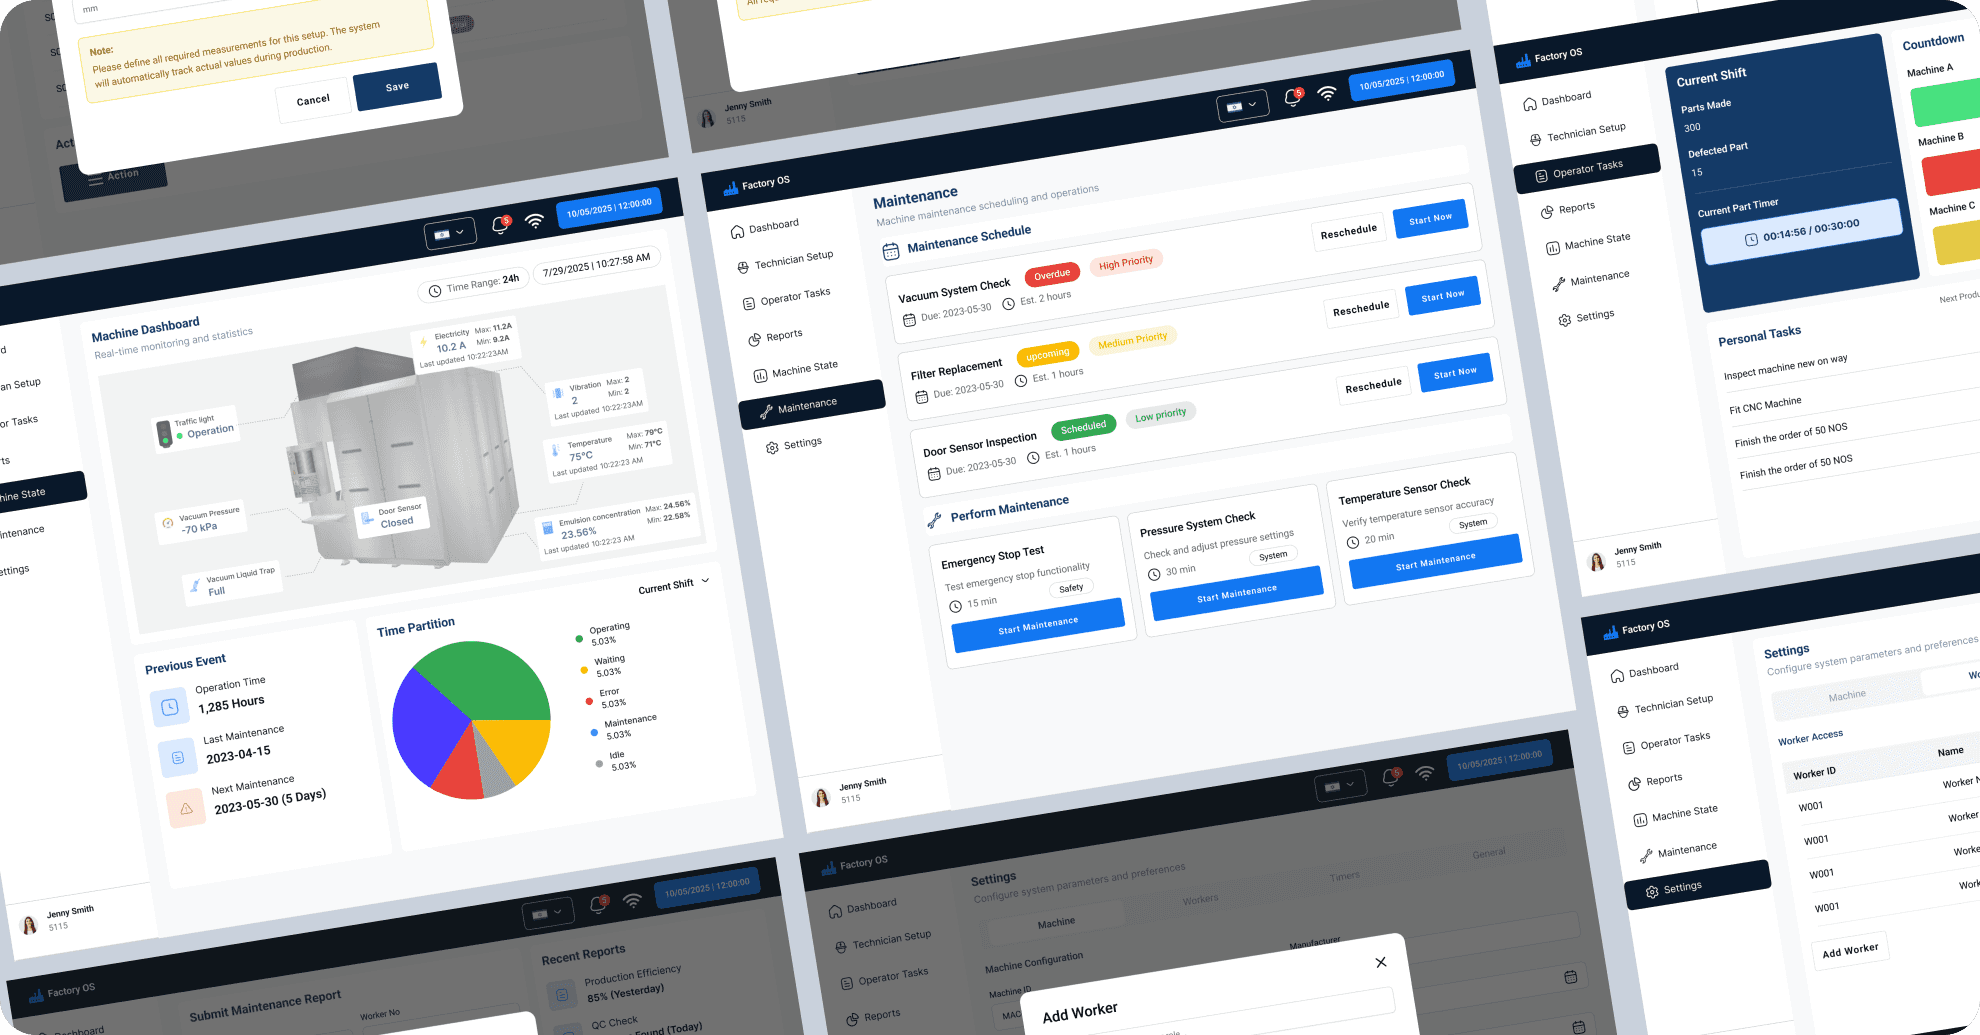
Reports visualize key metrics like performance trends, downtime, and alert frequency across custom time ranges. Predictive risk indicators help managers plan maintenance before failures occur. Users can export insights as PDF/CSV to share with teams and support data-driven decisions.
Reports visualize key metrics like performance trends, downtime, and alert frequency across custom time ranges. Predictive risk indicators help managers plan maintenance before failures occur. Users can export insights as PDF/CSV to share with teams and support data-driven decisions.
Reports visualize key metrics like performance trends, downtime, and alert frequency across custom time ranges. Predictive risk indicators help managers plan maintenance before failures occur. Users can export insights as PDF/CSV to share with teams and support data-driven decisions.

Results & Impact
Results & Impact
Every minute of machine downtime meant revenue loss. Gold-Tech needed a system that improved reaction time, decision-making, and task transparency.
Every minute of machine downtime meant revenue loss. Gold-Tech needed a system that improved reaction time, decision-making, and task transparency.
Every minute of machine downtime meant revenue loss. Gold-Tech needed a system that improved reaction time, decision-making, and task transparency.
Reduced monitoring and task-management time by approximately 30%.
Reduced monitoring and task-management time by approximately 30%.
Reduced missed operational alerts by approximately 40%.
Reduced missed operational alerts by approximately 40%.
Created a clearer workflow for monitoring machine health, operational tasks, and historical performance.
Created a clearer workflow for monitoring machine health, operational tasks, and historical performance.
Behind the Design
Behind the Design
Interviews and observation with managers and technicians helped identify three key needs:
Managers needed a clear view across the factory.
Technicians needed detailed machine information.
Teams needed a better way to identify urgent alerts.
Interviews and observation with managers and technicians helped identify three key needs:
Managers needed a clear view across the factory.
Technicians needed detailed machine information.
Teams needed a better way to identify urgent alerts.
Interviews and observation with managers and technicians helped identify three key needs:
Managers needed a clear view across the factory.
Technicians needed detailed machine information.
Teams needed a better way to identify urgent alerts.
These findings shaped the decision to create separate experiences for managers and technicians rather than forcing everyone into one dashboard.
These findings shaped the decision to create separate experiences for managers and technicians rather than forcing everyone into one dashboard.
These findings shaped the decision to create separate experiences for managers and technicians rather than forcing everyone into one dashboard.
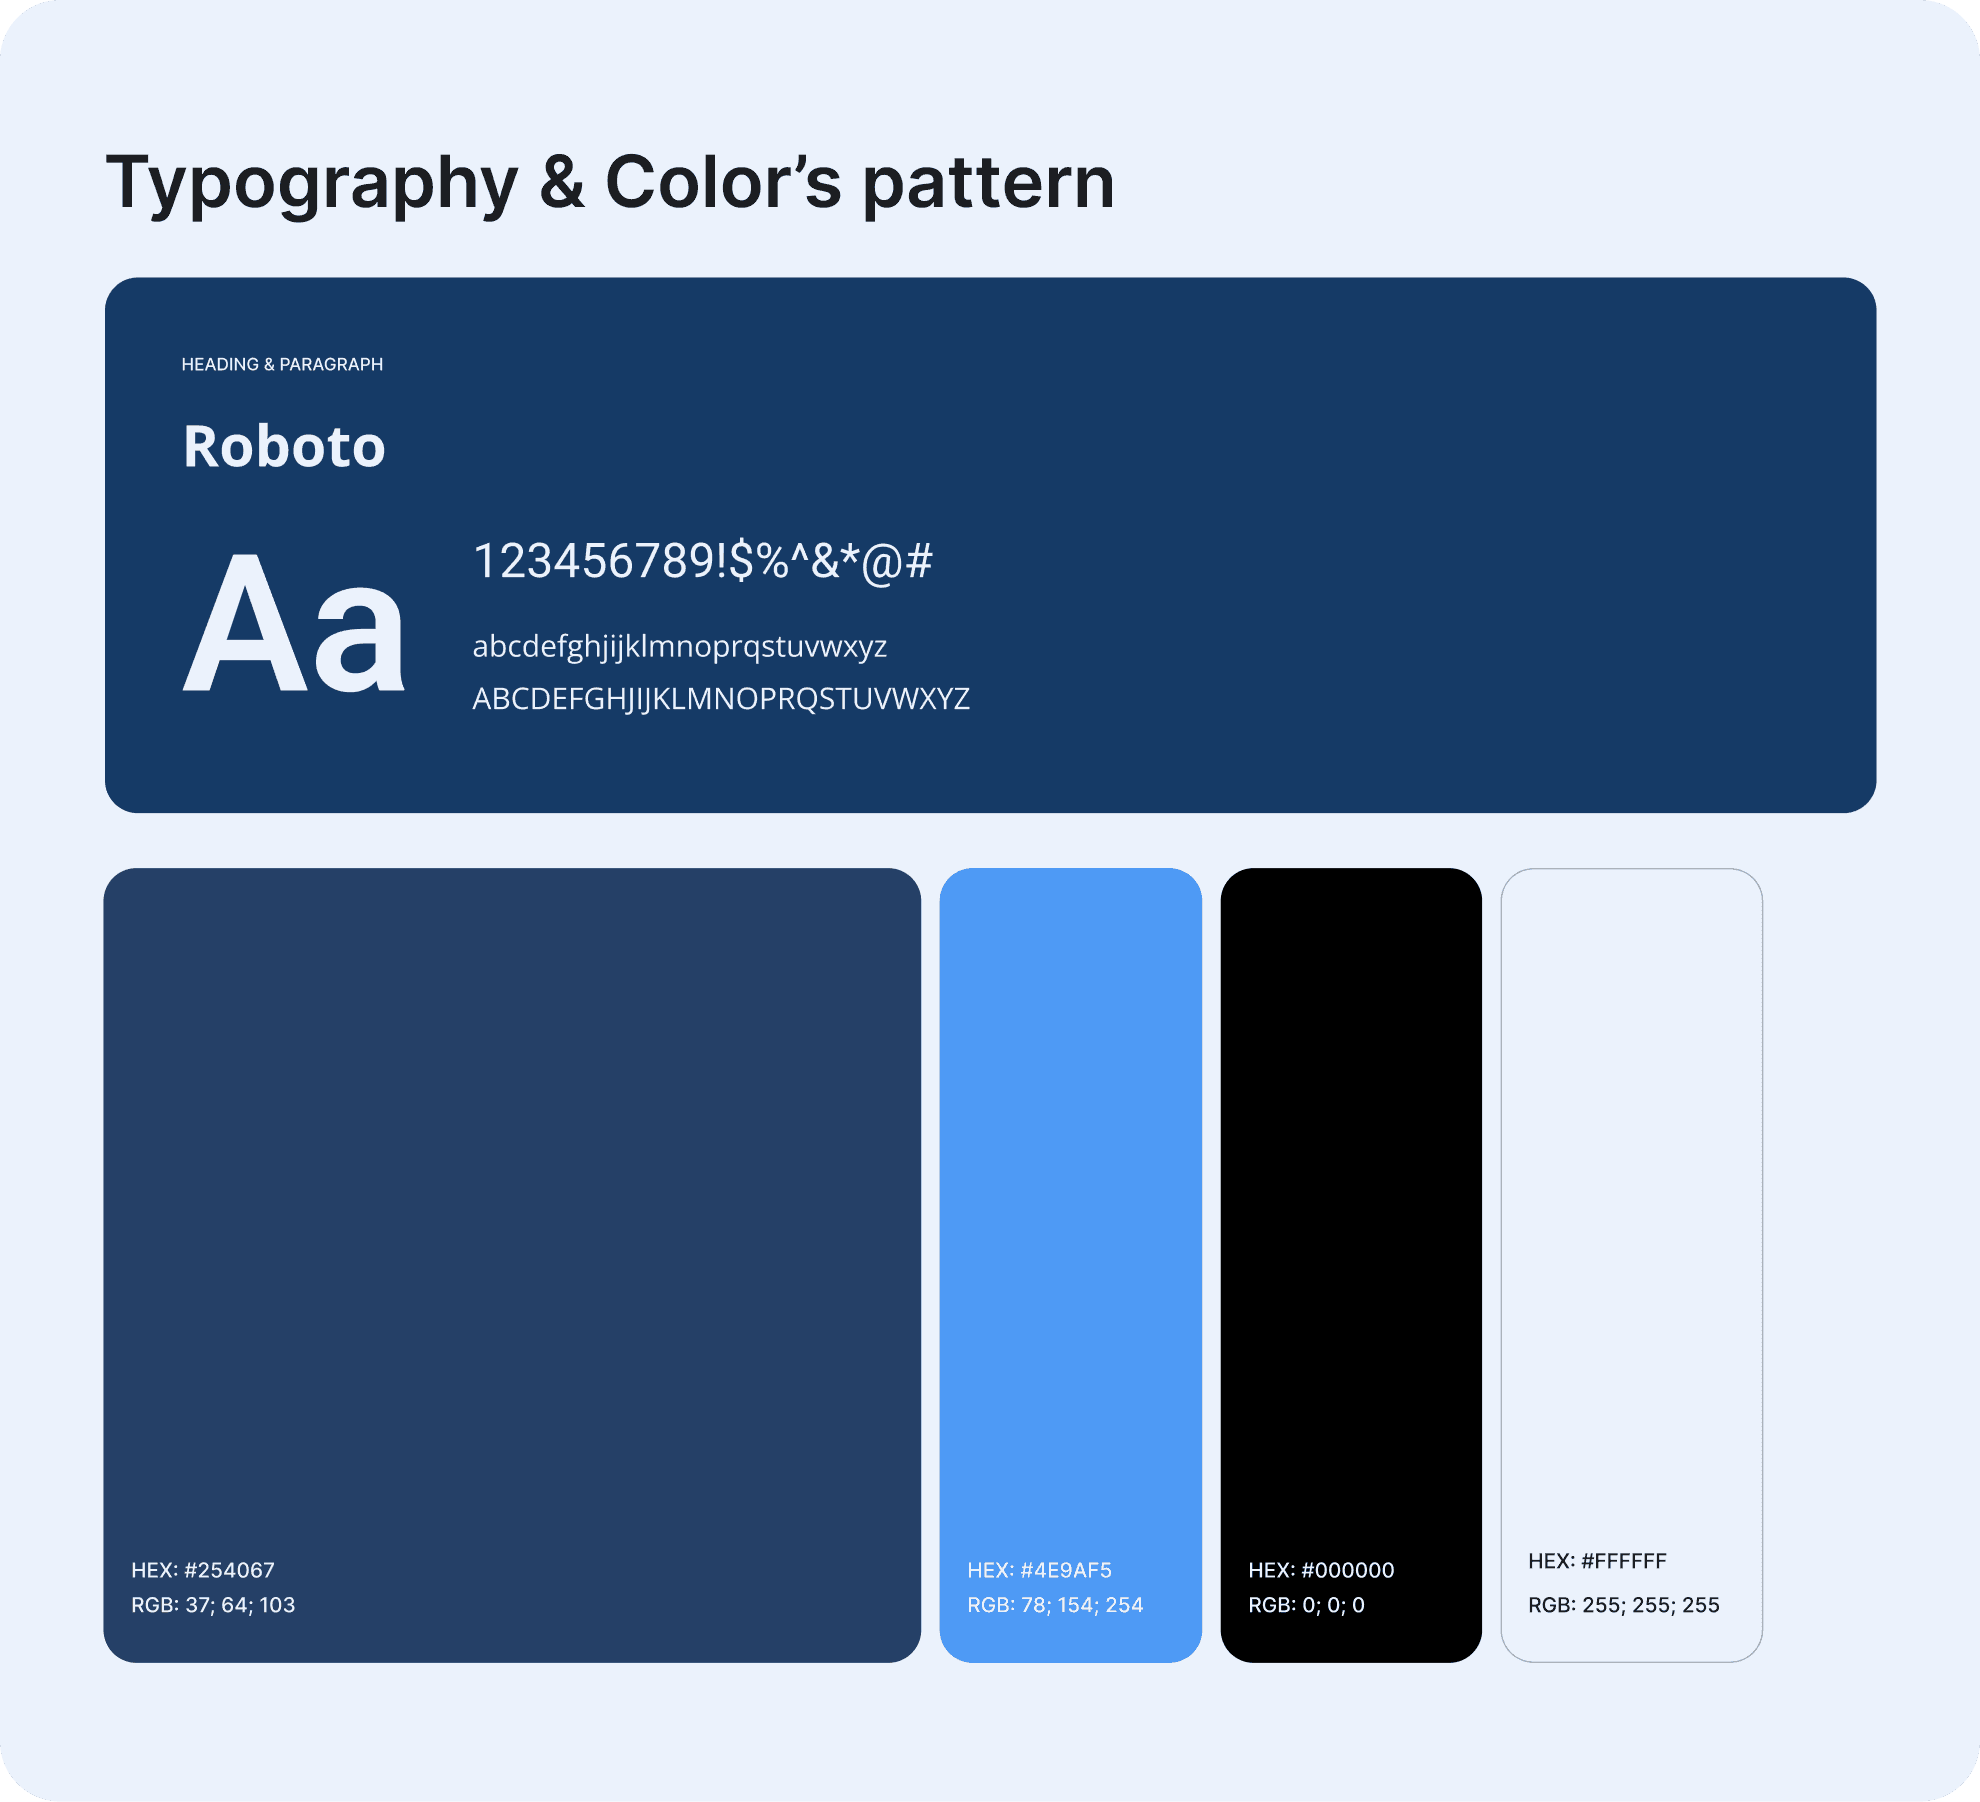
For the visual direction, I used Roboto with a bold navy and blue interface, designed to provide strong contrast and make important information easy to scan.
For the visual direction, I used Roboto with a bold navy and blue interface, designed to provide strong contrast and make important information easy to scan.
For the visual direction, I used Roboto with a bold navy and blue interface, designed to provide strong contrast and make important information easy to scan.
Research
Research
Research
Research was conducted with factory managers and floor technicians across manufacturing environments to understand how they currently monitor machines, respond to issues, and coordinate maintenance.
Research was conducted with factory managers and floor technicians across manufacturing environments to understand how they currently monitor machines, respond to issues, and coordinate maintenance.
Research was conducted with factory managers and floor technicians across manufacturing environments to understand how they currently monitor machines, respond to issues, and coordinate maintenance.
Methods Used
Methods Used
Contextual interviews with factory managers
Observation sessions on factory floors
Task analysis of existing monitoring tools
Journey mapping for both user roles
Contextual interviews with factory managers
Observation sessions on factory floors
Task analysis of existing monitoring tools
Journey mapping for both user roles
Key artifacts produced
Key artifacts produced
UX research notes & synthesis
User journey map (Factory Manager)
User journey map (Technician)
User flow diagrams
Role-based persona definitions
UX research notes & synthesis
User journey map (Factory Manager)
User journey map (Technician)
User flow diagrams
Role-based persona definitions
Managers need a cross-factory overview
Managers need a cross-factory overview
They monitor overall production health and compare issues across machines.
Technicians need machine-level context
Technicians need machine-level context
They typically focus on diagnosing a specific machine and resolving the issue quickly.
Alerts need prioritization
Alerts need prioritization
Not every machine event requires immediate action.
Two Products, One System
Two Products, One System
Two Products, One System
Web Platform
Web Platform
Browser-based dashboard for factory managers. Provides high-level monitoring, zone management, device configuration, manufacturing plans, alerts, and analytics reporting.
Browser-based dashboard for factory managers. Provides high-level monitoring, zone management, device configuration, manufacturing plans, alerts, and analytics reporting.
Real-time IoT floor visualisation (3D)
Zone & device management
Alert center & notifications
Analysis & reporting
Manufacturing plans
Real-time IoT floor visualisation (3D)
Zone & device management
Alert center & notifications
Analysis & reporting
Manufacturing plans
Desktop OS
Desktop OS
Installed desktop application for on-floor operators and technicians. Focuses on task execution, machine health details, maintenance workflows, and setup.
Installed desktop application for on-floor operators and technicians. Focuses on task execution, machine health details, maintenance workflows, and setup.
Operator task management
Machine health dashboard
Maintenance scheduling
Setup & technician config
Reports & scheduling
Operator task management
Machine health dashboard
Maintenance scheduling
Setup & technician config
Reports & scheduling
Additional Principles
Additional Principles
Critical information first
Critical information first
In industrial environments, operators cannot afford to hunt for data. High-priority alerts, machine status indicators, and always appear at the top of every view with clear colour-coded severity levels.
In industrial environments, operators cannot afford to hunt for data. High-priority alerts, machine status indicators, and always appear at the top of every view with clear colour-coded severity levels.
Role-based views
Role-based views
Factory managers see strategic overviews and trend data. Technicians see task queues and machine-level diagnostics. The same data, optimised for each role's context and decision needs.
Factory managers see strategic overviews and trend data. Technicians see task queues and machine-level diagnostics. The same data, optimised for each role's context and decision needs.
Reduce cognitive load
Reduce cognitive load
Complex factory data is visualised through clear charts, colour indicators, and health scores — never raw numbers alone. The 3D floor view gives spatial context that tables and lists cannot provide.
Complex factory data is visualised through clear charts, colour indicators, and health scores — never raw numbers alone. The 3D floor view gives spatial context that tables and lists cannot provide.
Action-oriented flows
Action-oriented flows
Every alert, machine issue, and anomaly has a clear next action — assign, acknowledge, escalate, or resolve. No dead ends. Status tracking ensures accountability across the entire workflow.
Every alert, machine issue, and anomaly has a clear next action — assign, acknowledge, escalate, or resolve. No dead ends. Status tracking ensures accountability across the entire workflow.
User Journey
User Journey

User Persona
User Persona


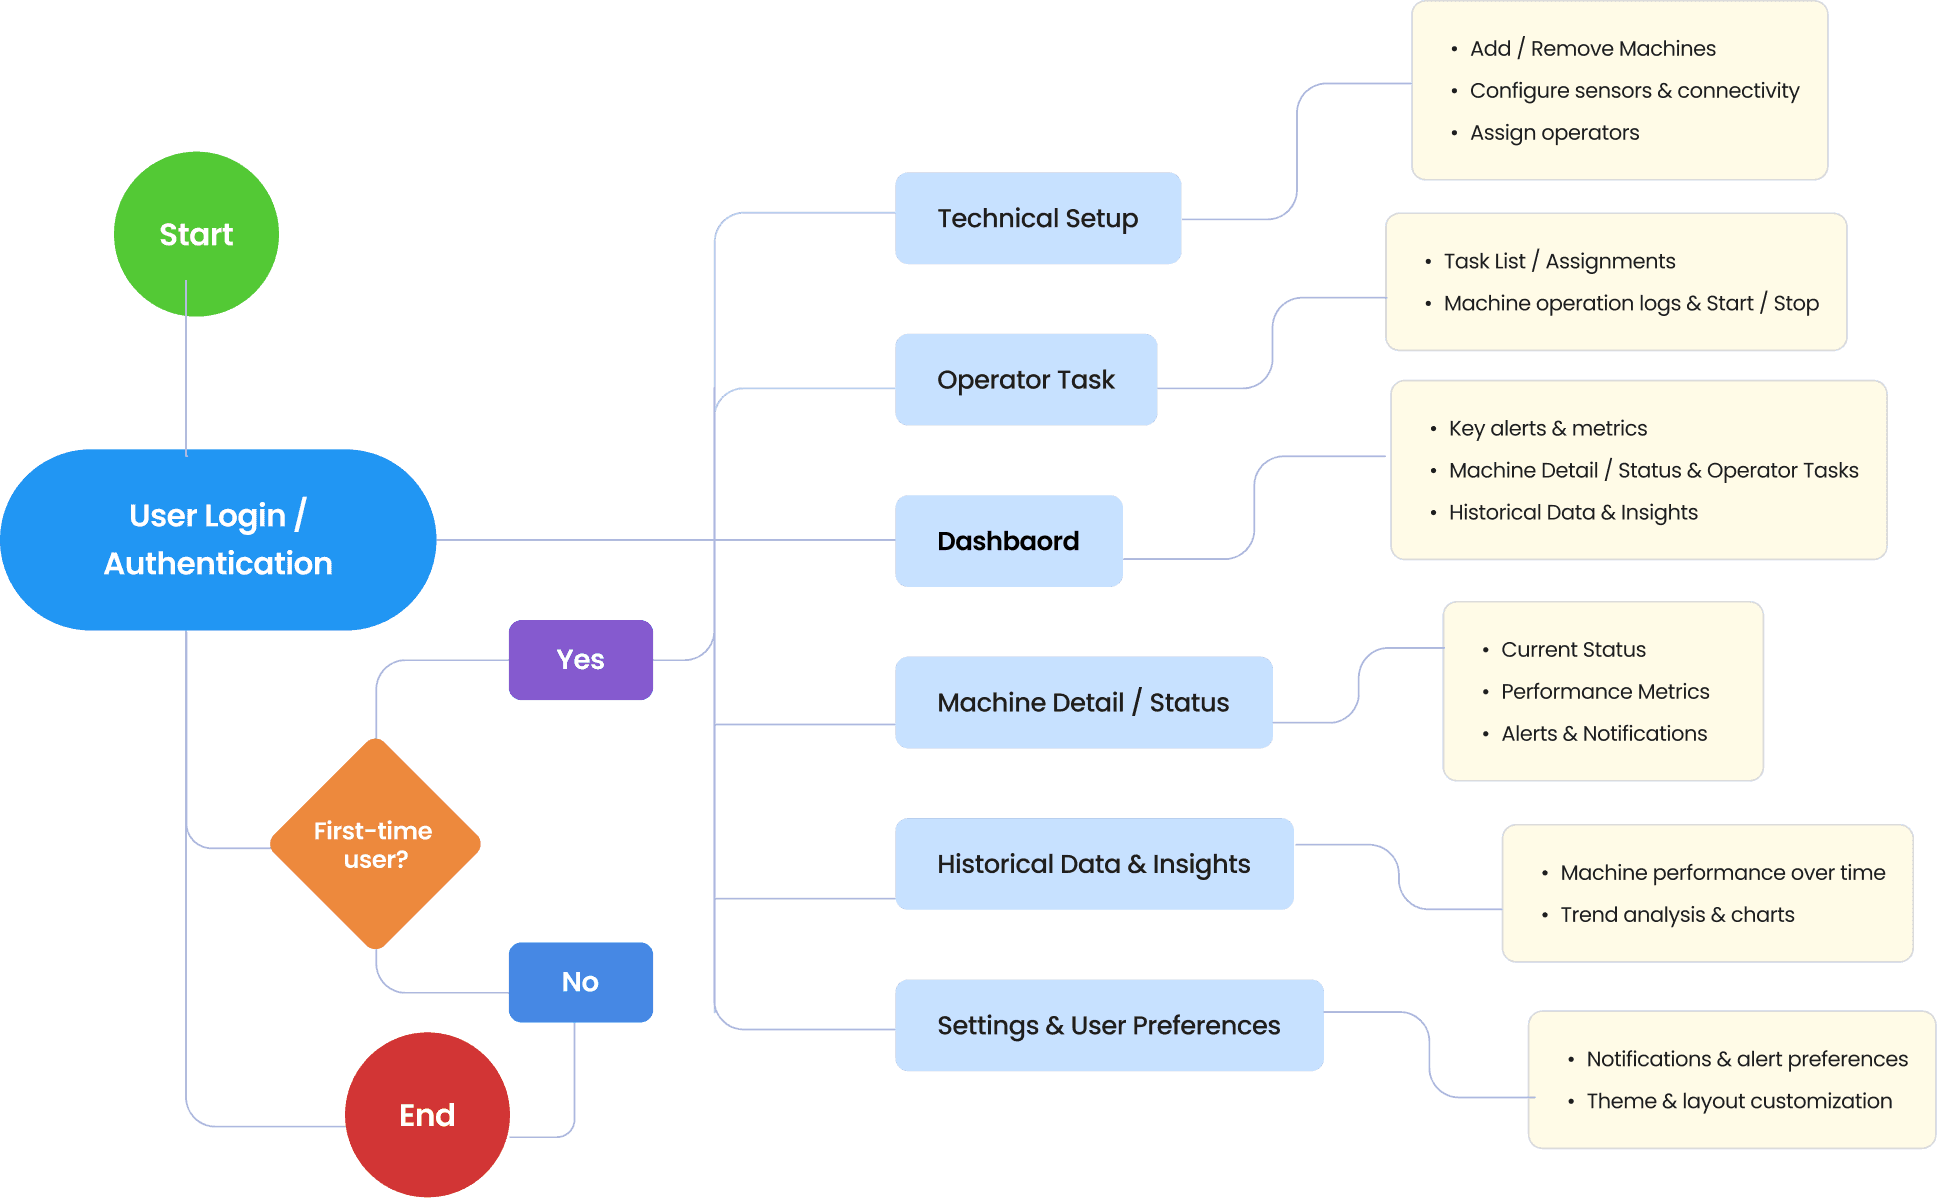
Product Architecture
Product Architecture
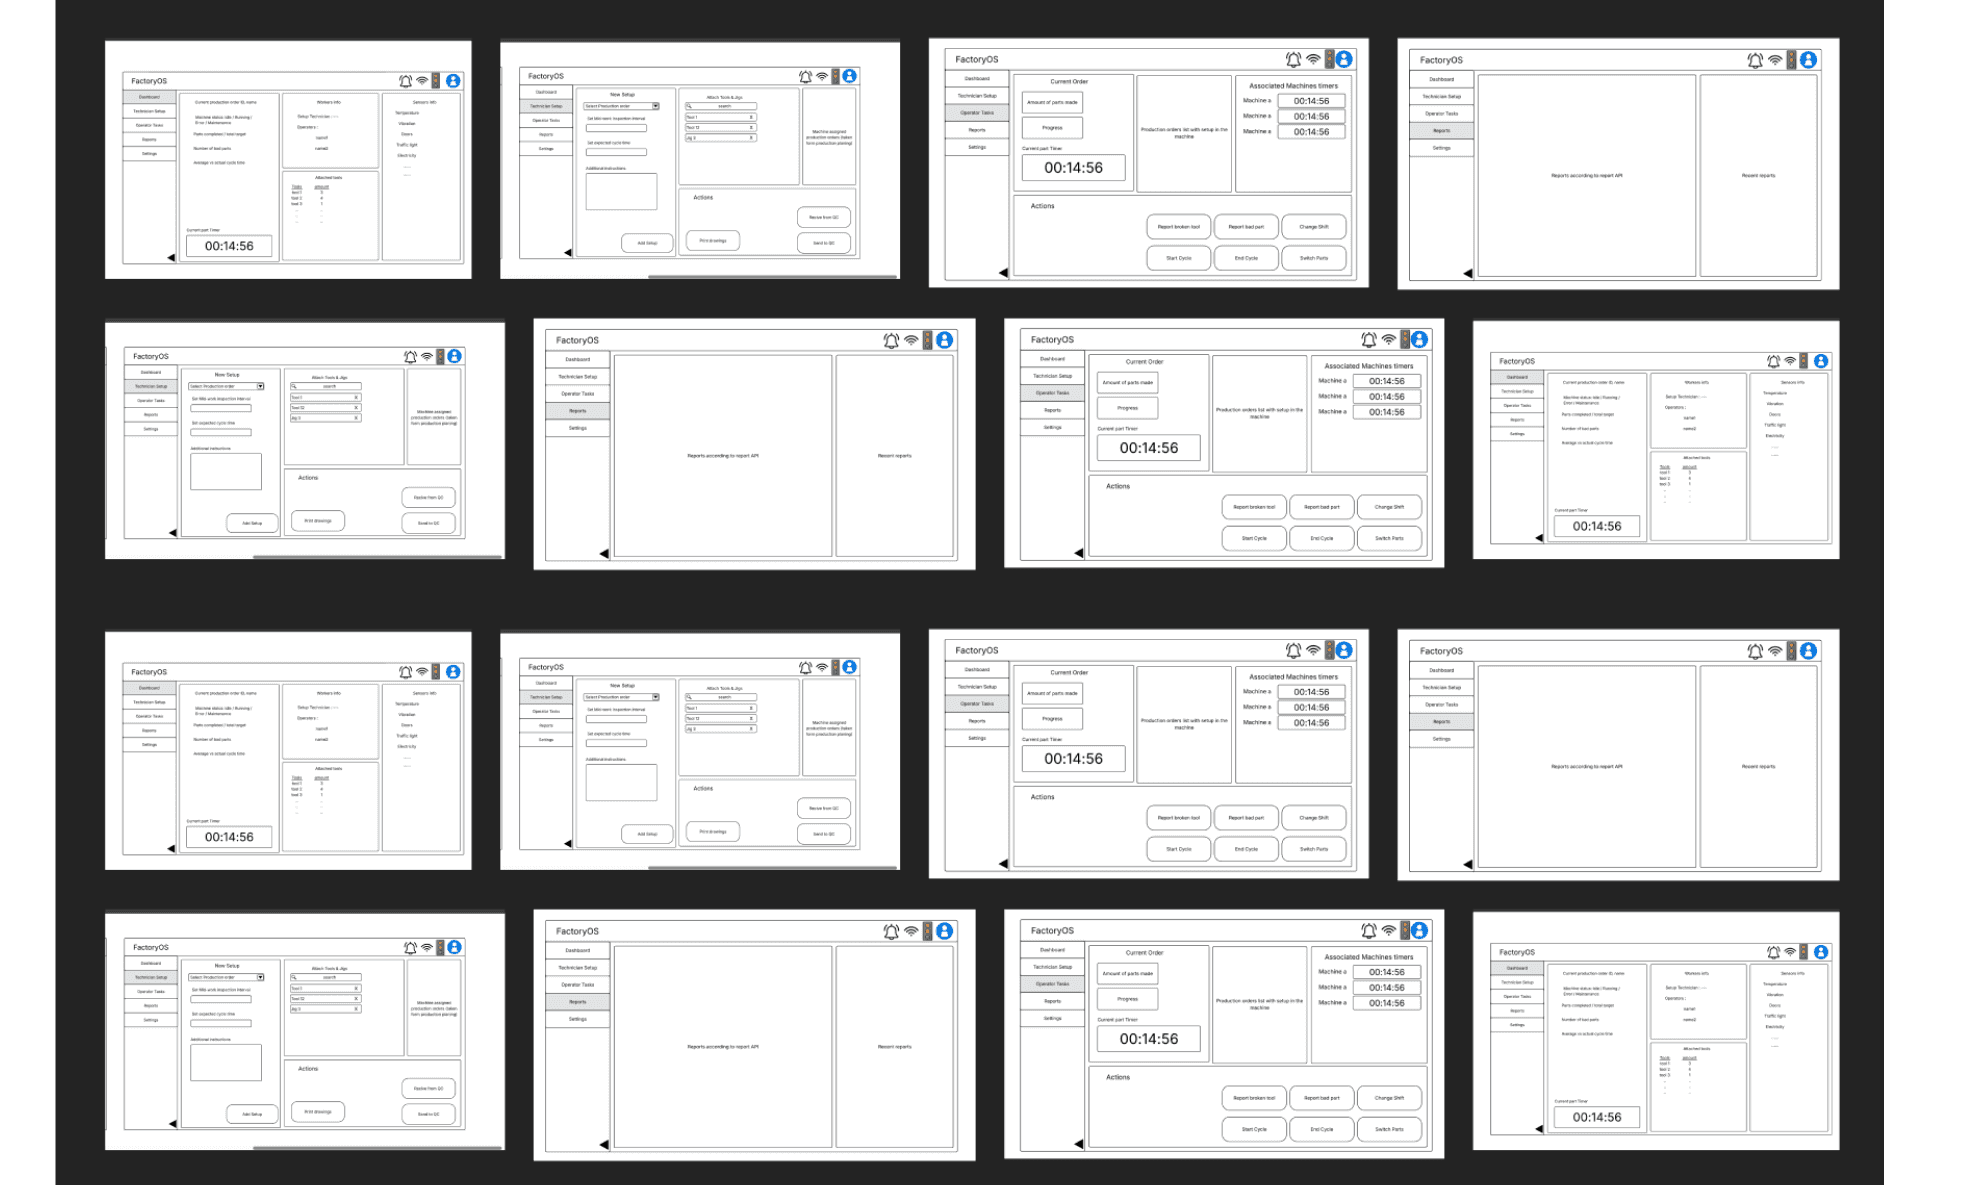
Wireframe
Wireframe
Design System
Design System
A balanced mix of bold Colours, typography, subtle neutrals, and intuitive iconography ensures data is readable, actionable, and easy to scan in high-pressure factory environments.
A balanced mix of bold Colours, typography, subtle neutrals, and intuitive iconography ensures data is readable, actionable, and easy to scan in high-pressure factory environments.
A balanced mix of bold Colours, typography, subtle neutrals, and intuitive iconography ensures data is readable, actionable, and easy to scan in high-pressure factory environments.